Global Computer Vision
1. Capturing the field’s image
1.1 Geometry of the field
In the RoboCup small-size league, the position of the robots on the field is determined using a video camera placed 3 meters above the field plane. According to the 2002 rules, the field should be 3.2 meters long and 2.4 meters wide. The 3.2 meters arise from 2.9 of effective field length plus 15 cm for each goal box on both sides. These dimensions correspond to the 4:3 aspect ratio used in standard video cameras. The robots have a maximum diameter of 18 cm and have color markers on top which are used to identify them, as well as detect their position and orientation. One of the robot teams carries a yellow marker in the center of the rotation axis, the other team carries a blue marker. "Yellow" and "blue" are defined somewhat loosely, but usually both teams try to agree on the colors to be used before a game starts.
Figure 1 shows the geometry of the situation. With the camera placed 3 meters above the floor, the camera ocular needs to cover an angle of 56.2 degrees for the longest width and 43.6 degrees for the shortest. The standard opening angle for video cameras is 20 degrees. 56.2 degrees already approaches the limit of standard wide angle lenses (super-wide angles start at 65 degrees). Therefore, the first problem to be solved is just seeing the field using a system of lenses that can keep the field distortion low.
If the image captured by the computer has a resolution of 480 lines by 640 columns (also a 4:3 ratio), this means that each square pixel is equivalent to a 5 by 5 mm patch of the field (shown as a red square in the figure above) . Obviously, much detail can be contained in a patch of this size, and this will be one of the main problems we will find when dealing with color processing.
Tracking color markers using the output from the video camera is not a trivial task. There are several problems that have to be solved in order to find the robots and the ball, and follow them in real time. In this chapter we review the most important ones.
1.2 Geometric Distortion
We have to deal with the geometric distortion introduced by the wide angle lens of the camera. If the video camera could be hung 5 or even 10 meters high, it would be possible to zoom into the field and get a good rectangular image (since no wide angle lens would be necessary). The geometric distortion produced by a wide angle lens is usually of the “barrel” type, that is, lines which do not got through the center become curves, the farther the distance from the center, the larger the curvature of the line.
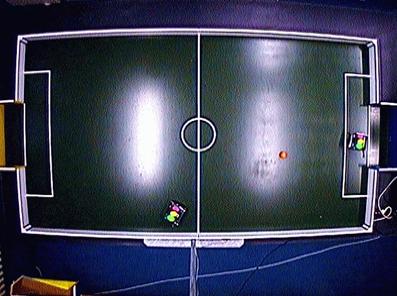
Figure 2: An example of barrel distortion from the wide angle
Figure 2 shows the distortion produced by the wide angle used to capture the image. Different types of lenses have different distortions. In this particular image, the distortion is not as large as with other types of cameras. The particular type of distortion in this image is called barrel distortion, the opposite of pincushion distortion, which is sometimes produced by teleobjectives (Figure 3).
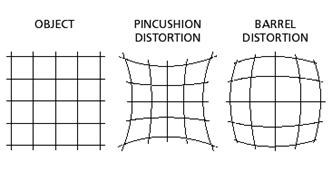
Figure 3: Examples of pincushion and barrel distortion
Figure 4 shows the distribution of the distortion on the field. As can be seen from the image, the distortion is minimal in the center of the image and larger at the corners. The pixel coordinates of the image do not correspond exactly to the field coordinates and we need a method to map pixel coordinates to field coordinates. Figure 4 shows an image of the checkerboard pattern used by a RoboCup team for calibrating the camera, that is, for defining the map from pixels to coordinates.
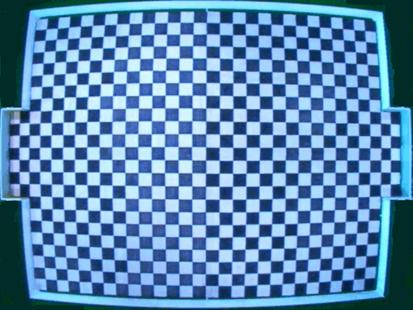
Figure 4: The checkerboard pattern used by the Cornell team to calibrate the camera
Geometric distortion is caused by the mismatch between the size of the imaging chip, the size of the lens, and the aperture angle. A wide aperture angle can be obtained by making the lens rounder. Fish eyes used in photography consist of a system of lenses and the most external lens has a very curved surface. Figure 5 shows the Fisheye-Nikkor 8 mm, introduced in 1970. This particular lens can capture images at an angle of 220 degrees. Such lenses are very popular for surveillance cameras which can image a complete floor in a parking building, for example.
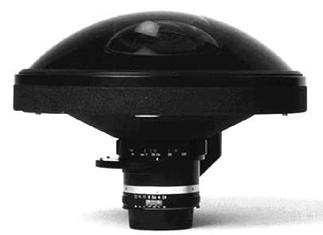
Figure 5: The Fisheye-Nikkor 8 mm lens
Figure 6 shows the internal structure of the Nikkor fisheye lens. The purpose of the stack of lenses is to “bend” light more and more until all light captured by the lens is projected directly onto the film, as if the image was coming directly from the front. This kind of lenses produce a circular image: rectangles are rounded at the corners.
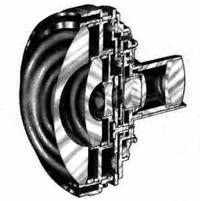
Figure 5: Stack of lenses used in the Nikkor fisheye
Since the distortion introduced by wide angles is substantial, some kind of optical correction is done using special combinations of lenses (color aberration is also an important issue which is handled by combining lenses). Barrel distortion can be corrected using off-the-shelf image processing software, but in our case we are interested in a correction that can be done in real-time. Lenses capable of correction the geometric distortion introduced by wide angles, are called orthoscopic. An example of this kind of lens is the Mamiya 43 mm Ultra-Wide Angle with an angle of view of 92 degrees and only 0.04% distortion at the corners.
The distortion introduced by a wide angle can be illustrated with Figure 6. Barrel distortion is produced when the lens is behind an aperture that limits the angle of view. In barrel distortion higher objects (y in the Figure) correspond to a smaller image (h in the image).
Figure 6: Origin of barrel and pincushion distortion
The distortion introduced by a lens is provided by manufacturers using two curves. The first (left curve, Figure 7) shows the error percentage in the mapping. An error of –1% means that the radial distance from the center of the pixel image is 1% smaller than it should be. The second curve shows the derivative of the first curve. Barrel distortion is present when the derivative is negative, pincushion distortion when it is positive.
Figure 7: Distortion curves for a Zeiss lens
1.3 Software correction of geometric distortion
There are several approaches for correcting barrel distortion in software. The simplest one is to use a checkerboard pattern, such as the one shown in Figure 4, and detect the corners. Since the field coordinates of the corners are known, it is possible to map corners in the pixel image to field coordinates by simple table look-up. For pixels between corners, linear interpolation can be used to determine the field coordinates.
Another way of determining the position of the grid nodes is by using a colored pattern, as shown in Figure 8. The advantage of this type of pattern is that the centers of the nodes can be determined more precisely, by looking at the distribution of the pink color. The lens used for this picture has significant distortion as can be seen from the image.
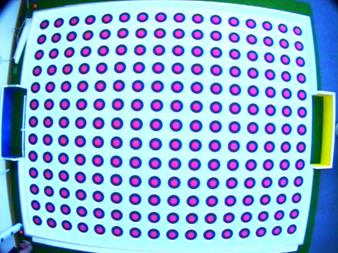
Figure 8: A grid for distortion correction
It would be also possible to compute the distortion curve for the lens, but since the camera is not necessarily at the center and its lens plane could not be parallel to the field plane, the necessary corrections are complex and change if the camera is slightly moved. Also, the camera can be slightly rotated (as in the Figure) and this affects also the necessary corrections.
1.4 Barycentric coordinates
Assume that we are given a mesh (a rectangular grid) and we know for each node of the mesh its two-dimensional coordinates (x,y). If the mesh is projected by a lens onto an image and has some distortion, the pixel coordinates of each node can be stored in a table. Our problem is: given the pixel coordinates of a point P compute its field coordinates knowing the field coordinates of its three nearest neighbors. The situation is illustrated in Figure x. To the left we see the distorted mesh, to the right the undistorted mesh in field coordinates. The point A has pixel coordinates (a1,a2) and field coordinates (A1,A2), and correspondingly for the other points. Given the pixel coordinates (P1,P2) of Point P, we would like to compute its field coordinates (p1,p2).
For solving this problem we can compute the barycentric coordinates of the point P in the pixel image. The three barycentric coordinates of the point P are given by:
Pa = (Δ PBC / Δ ABC) Pb = (Δ PAC / Δ ABC) Pc = (Δ PBA / Δ ABC)
where Δ represents the surface of the associated triangle. The interesting thing about barycentric coordinates is that they are invariant under affine transformations (projections, translations, rotations). Assuming that the distortion of the mesh can be approximated as an affine transformation, we can just assume that the barycentric coordinates in the pixel image and in the field image are the same.
From the barycentric coordinates (which we can compute directly from the pixel image) we obtain the field coordinates from the equality:
(P1,P2) = Pa*(A1,A2) + Pb*(B1,B2) + Pc*(C1,C2)
This method is applicable if the triangles in the mesh are small enough to justify approximating the non-linear barrel distortion with an affine transformation.
2. Color processing
2.1 The nature of color
Color markers are used in the RoboCup domain and also in many other robotic applications. Color processing is a fundamental part of image processing in mobile robotics. Our eyes and brain can deal with color in an automatic way – we do not know how we do it, but we can perceive and classify colors effortless. The problem for robots is that color is a subjective experience and the video sensors used in cameras provide only a measurement of luminosity and a range of wavelengths. But there is more to color processing than meets the eye.
Figure 9: Scheme of the eye and the retina
Our eyes do not perceive light the same way as sound is perceived. As a first approximation, the color of light is the wavelength of its associated photons. But we do not measure with the retina directly the wavelength of light. The ear does a kind of frequenvy analysis and it is therefore capable (together with the brain) of recognizing sound mixtures as mixtures (at a concert, for example). The eye sensors have a very good spatial localization but a very fuzzy frequence localization.That is, the retina is plastered with millions of color sensitive rods (some researchers say 120,000 pixels), but every rod is sensitive only to blue, green or red light (in a certain range). Figure 10 shows the response curves for the three types of rods. Light of wavelength 450 nm, is represented by three numbers which give the proportional response of the three kinds of rods. White, in particular, is the color we perceive when the response of all three types of sensors is approximately the same.
2.2 Color constancy in humans
Edwin H. Land, founder of the Polaroid corporation, did considerable research about the nature of color vision and could prove that color vision is not a point but a field phenomenon. That means, the color of a single point in an image does not depend alone on the light reflected by that point, but on its relationship with the light reflected from points in its neighborhood.
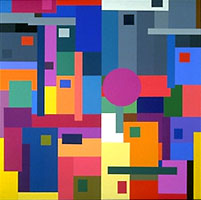
Land worked with patches of different colors projected on a screen. The resulting images are called Mondrians. One such image is shown above.
One of Land’s experiment was the following: he covered all patches except a blue rectangle. He adjusted the illumination so that the light reflected from the rectangle would have a flat spectrum, i.e. so that the rectangle looked gray to the eye. Then, without changing the illumination, he would uncover the other patches and the rectangle would again look blue. In another experiment he measured the spectrum reflected by a green patch, then changed the illumination so that a blue patch would reflec exactly the same spectrum: the blue patch still looked blue.
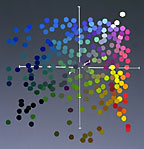
These experiments show that the spectrum reflected by a patch is processed differently in the retina and in the brain according to the spectra of the other patches. According to Land the spectrum at one point is normalized comparing it with the spectrum at all other points in the image. Land performed this calculation for three wavelenghts: short, medium and long (which corresponds to the blue, green, and red bands). His particular algorithm is called the retinex theory of color constancy. In the retinex theory, colors are mapped to three axes, one for each band. The figure below shows the retinex color space, that is, the relative position of each color in this three-dimensional representation. The diagonal from the lower left to the upper right, runs through the gray tones, from black to white.
The retinex algorithm is based on the computation of illumination independent “lightness” values. Lightness at a point xp is computed as:
Lp = 1/N Σ (log(I(xp)) – log (I(xi)))
Where the xi are N points selected randomly from the neighborhood of xp. The calculation is performed independently for the R, G, an B channel.
This would be not very interesting for robotics if the world was not organized according to color codes designed for humans. If humans perceive some colors as being identical, then a robot should also do so. Unfortunately much work has still to be done until we fully understand color constancy in humans and until we can implement the necessary computations in real time, since these are global computations involving the whole image and not only an isoltade point.
2.3 Video standards
Video cameras have been designed primarily for television reproduction, although many new camera models have been built for microscopy applications. In the case of video cameras for TV, there are several international standards. In the USA, the NTSC standard is used, in Europe PAL and SECAM. The table below shows the main characteristics of the different standards. NTSC provides more frames per second (30) than Pal (25), but the resolution of the PAL standard is better (575 by xxx vs. 480 by 640). Computer formats (XGA for example) are much more dense but it is difficult to find video cameras with such high resolutions and capable of transmitting the image to the computer in real time.

At 480 by 640 pixels, each video frame consists of 307,200 pixels. Every color pixel must be represented using three numbers (for three different color sensors). If only eight bits are used, the camera needs to transmit around 2.4 million bits every 1/30th of a second, that is, around 72 million bits per second. Until recently such high transmission links were not available for conventional desktop computers. Therefore the usual strategy is to transport the analog signal from the video camera to the computer and capture the image using a framegrabber connected directly to the memory bus.
There exist now digital video cameras that can be connected using Firewire (IEEE 1394) or USB-2 connectors. The first standard provides up to 400 Mbs, the latter 480 Mbs. If the signal is compressed, there is usually not enough time to decompress the signal inside the computer. It is better to receive the raw signal and then process it.
In the case of an analog signal, there are different types of encoding. If the signal travels along a single pair of cables (one of them is earth) the color information has to be encoded using an elaborate scheme. Color video signals are superimposed on the information used for black and white TV. This is the luminance, that is, the perceived brightness of each pixel. BAS video connectors use this approach.
The S-standard transmits color information using two active lines (and one earth for each cable, twisted around it). The first line encodes the luminance
2.4 Color spaces
A color space is a way of coding a color using several color components. Since the purpose of color coding is reproducing it to fit the expectations of the eye, it is not surprising that the three basic colors used for “mixing” all other colors are red, green, and blue. This is called RGB color coding. The figure below shows schematically the colors that are perceived by the eye when the relative proportions of red, green and blue are changed. The origin, a (0,0,0) mix, is black. The point (1,1,1) represents a balanced mix of the three basic colors and is therefore white.
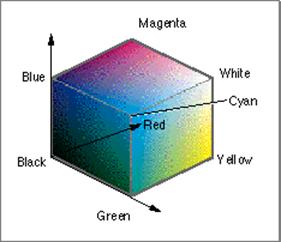
Other corners of the RGB cube are magenta, cyan, and yellow, which correspond to the mixes (1,0,1), (0,1,1), and (1,1,0). These colors can be also used as basic colors and their mix can produce any of the other colors.
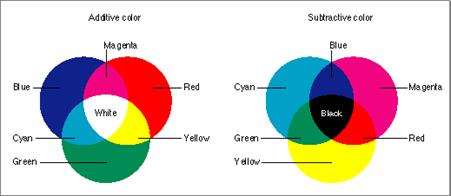
In additive color mix, the colors are added to each other. Red, green, and blue together produce white, since (1,1,1) = (1,0,0)+(0,1,0)+(0,0,1). In subtractive color mix colors are subtracted from one another. This happens when ink is mixed and each type of ink absorbs light of specific wavelengths. Cyan (0,1,1) absorbs red, magenta (1,0,1) absorbs the green component, so only the blue component remains. The figure below shows the difference between additive and subtractive color mix. In color monitors and color TVs, additive color mixes are used, since light of one color emitted by the screen does not cancel light of another color emitted also by the screen.
The color processing done in the brain actually combines the individual measurements at each rod in the retina. Color spaces are transformations of the RGB cube designed with the purpose of best capturing the kind of color classification done by humans. There are many different color spaces, each with its own rationale.
One important example is the HIS color space. HIS stands for hue, intensity and saturation. The intensity I is just the average of all color channels at one pixel:
I = (R + G + B)/3
The saturation measures how far away the color is from the diagonal in the RGB cube. The diagonal corresponds to colors of the type (x,x,x), that is colors with equal contributions of red, green, and blue, that is shades of white (gray values). The farther away a color is from the diagonal, the more vivid it looks. Saturation is measured by computing:
S = 1 – 3*min(R,G,B)/(R+G+B)
For any shade of gray R=G=B, and therefore S = 0.
A pure color, such as R=1, G=0, B=0, has a saturation S =1. Cyan is the combination (0,1,1). For this combination the saturation is:
S = 1 – 3*0/2 = 1
And in general, any color on the faces of the cube and not in the diagonal, has a saturation of 1.
Usually the HIS color space is represented using a circle, The colors change according to the angle in this circle. This corresponds to viewing the colors in the direction of the diagonal. The hue H, therefore, is just the angle at which the color is located.
H = cos^(-1) ( (0.5*((R-G)+(R-B))) / ((R-G)^2 + (R-B)*(G-B))^(0.5)
)
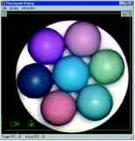
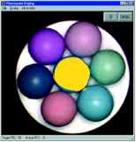
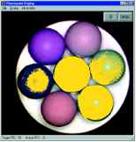
The example below shows how several spheres are classified when looking only
at the hue of the image (second image from the left). Several colors seem
to be very similar to the central cyan sphere. If the intensity is also considered
(third image from the left) then now only the bright parts of other colors
can be confused with cyan. If, finally, the saturation is considered, the
color separation is now perfect for this application.
 |
 |
 |
 |
Whatever color space is used, most color digital cameras do not use more than three basic colors for capturing the image. This is done by placing color filters in fron of the chips used in the digital cameras, which are actually only capable of distinguishing dark from light.
2.5 The Bayer and Similar Color Filters
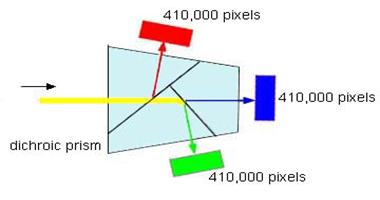
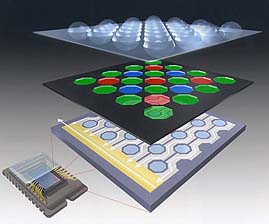
In general, the sensor chips used in color cameras can only provide a black or white picture. In order to detect different colors, color filters are needed. If a prism splits the incoming light, so that red, green and blue tones are separated, then three chips are needed. The three images in a 3CCD camera can then be combined pixel by pixel to obtain a color image. The figure shows a prism used in a commercial camera for splitting the incoming light in three directions. In each direction a 410,000 pixels chip senses the image and provides a measurement for the camera.
In more conventional cameras, only one sensor is used but every pixel is covered by a different color filter, usually red, green or blue. This means that at each pixel only one of these colors will be measured, but the missing color information for each pixel can be extrapolated from its neighbors. The figure below shows the arrangement for a CMOS camera. At each pixel there is the electronics needed to measure the incoming light. A photodiode transforms light quanta into a charge, which is collected in a potential well. A microlens above the pixel concentrates the light on the electronics. Below the microlens there is a red filter which lets red light through and absorbs other frequencies. This is a pixel “specialized” in measuring red light.
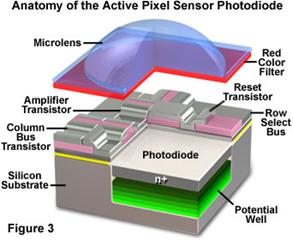
http://micro.magnet.fsu.edu/primer/digitalimaging/cmosimagesensors.html
Of course, not all pixels can be specializd to measure red light. Like in the retina, some pixels are covered with a read, and others with green and blue filters. The picture below shows an arrangement for a Fuji camera. A layer of microlenses is placed above a layer of filters, which in turn cover a layer of pixel sensors. In this special case the sensors are distributed in an hexagonal array.
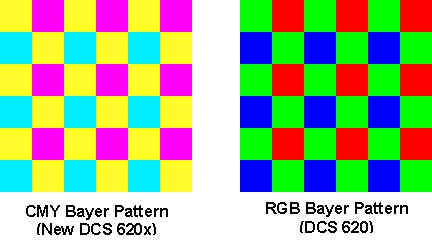
More typical for video and digital cameras is a distribution of pixels as rectangular arrays. A common arrangement for the color filters is shown in the figure below, to the right. This arrangement is called a Bayer Filter, because it was invented at Kodak by one Dr. Bayer. As can be seen, in the Bayer array half of the pixels have a green filter, the color for which the human eye is more sensitive. The red and blue filters are arranged in rows and columns, with one missing pixel in each direction. At the time Bayer registered his patent, he also proposed to use a cyan-magenta-yellow combination, that is another set of opposite colors. This arrangement was unpractical at the time because the necessary dyes did not exist, but is used in some new digital cameras. The advantage of the new CMY dyes is their greater light absorption characteristics, or what is called, its quantum efficiency.
Once the chip has been exposed to an image, each pixel can be read. A pixels with a green filter provides an exact measurement of the green component. The red and blue components for this pixel are obtained from the neighbors. For a green pixel, two red neighbors can be interpolated to yield the red value; also two blue pixels can be interpolated to yield the blue value. There are several different methods that can be used to combine the pixel values – this process is called demosaicing. They differ in the kind of artifacts that can be produced (see below).
The graph below was produced by Kodak and shows the absorption efficiency of the different types of dyes they use. As can be seen, magenta, cyan and yellow, have better absorption characteristics.
Still another popular filter is the CMYG filter, in which cyan, magenta, yellow and green filters are used. The arrangement of the filters is shown in the picture below.
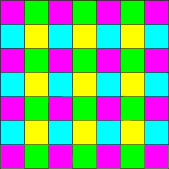
As can be seen, green pixels alternate with yellow pixels, and magenta with blue. Another common filter array places columns of red, green and blue filters one after the other. In that case the horizontal resolution is a third of the vertical resolution.
2.6 Demosaicing Techniques
Once a picture has been taken, it has to be transformed in one of the standard image formats, for example RGB or S-VHS. Transforming from a Bayer filter to RGB can be done interpolating the sensor values at different places in the array.
The figure below shows the general approach. The green component of a pixel can be measured directly at any pixel with a green filter (50% of all pixels). Where the green value is missing, it can be interpolated from the four neighboring pixels with a green filter. Since the eye is more sensitive to green, more surface of the color array is used for this color. In the case of blue and red, missing information can be interpolated from the neighbors. There are two cases: the pixel has two or four direct pixels of the desired color.
2.7 Color artifacts
Color artifacts in the RoboCup images are produced by a series of different effects. The picture below shows two effects. First, due to interlacing of the video image, the even and odd lines were captured at different moments. It can be seen that there are obvious differences in shades of color. This can be due to the illumination of the room. Halogen lamps usually flicker. The flickering is almost invisible for the human eye, but it affects the digitization of the image.
The second effect is the appearance of phantom colors due to interpolation in the Bayer filter. Between the ball and the white (should be white!) boundary there appears some violet. Between the green field and the white boundary we can see shades of green. The diameter of the orange golf ball is around 4.25 cm. Since each pixel measures 5 by 5 mm, the ball covers around contains around 56 pixels, of which only around half of them are of the appropriate or similar color. Therefore, small colored objects appear even smaller when only the expected object colors are selected.
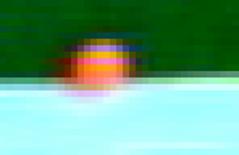
Figure : False colors at the boundary of colored objects
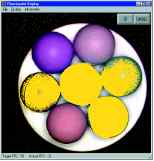
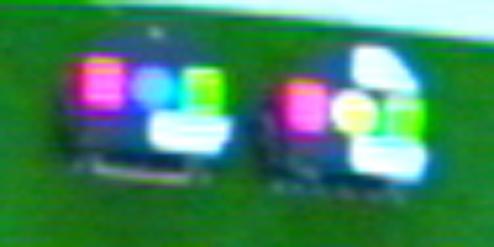
In the next picture we can see how colors “spill” into one another. The white patches have a blue boundary. The cyan marker (0,1,1) spills onto the green (0,1,0) marker and produces cyan (0,1,1), and the magenta (1,0,1) marker spills onto yellow (1,1,0) to produce white (1,1,1). The artifacts shown here are of the additive type.
2.8 Color temperature and filters
The color of objects can be perceived differently according to the spectrum of the illumination. We are not aware of this fact, because the human eye and brain excel in filtering out such perturbations, so that the perceived color of the objects can remain approximately constant. Nothing more confusing for a computer, which can perfectly “see” with its sensors that the colors reflected by objects are different according to the illumination.
 |
 |
Photography experts know that before taking pictures, the spectrum of the ambient light has to be determined. Incandescent and halogen lamps can be thought as systems in equilibrium, irradiating a mixture of wavelengths determined by their temperature. This is the main characteristic of a black body, a cavity in which all radiation has reached equilibrium. As shown in the picture above , the radiation escapes through a small hole in the surface. The spectrum of the black body changes according to its temperature measured in Kelvin, as shown in the diagram to the right. The temperature of illumination systems is given in Kelvin. Day light is rated at around 5000 Kelvin and has a blue tint. Early morning light has a red tint. A photographer will different kinds of filters in order to balance the light spectrum and make it appear white. This is called white balancing, and can be done by the camera itself or can be processed a posteriori in software.
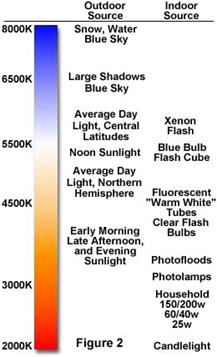
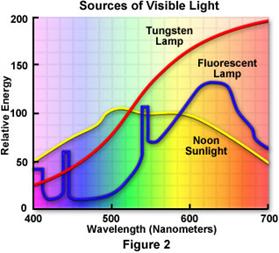
The figure below shows the spectra for a tungsten lamp, a halogen lamp and sunlight. Sunlight is the more balanced of the three. The tungsten lamps tend to make the scenes appear redish or yellowish. Flurorescent lamps have a similar effect, but not as pronounced.
In the case of digital cameras, white balancing can be done by modifying the gain of each color channel. If the camera provides the computer with RGB values for each pixel, then white balancing can be done by rescaling these values. If the software is converting the values from the RGB to the HIS color space, the rescaling can be done on the fly, without losing computer time.
3. Hardware
3.1 Cameras
Selection of the ideal camera for robotic applications is not an easy matter. On the one hand, we are interested in as much sensitivity and quality as possible, but also on the size and portability of the camera. Cheap small digital video cameras tend to have very poor optics and this produces color aberration problems as well as distortions.
Factors affecting the choice of video camera:
- output: digital or analog
- interlaced or progressive scan
- RGB or YUV coding
- frames per second
- video format (PAL or NTSC)
- size and power consumption
- frame grabber
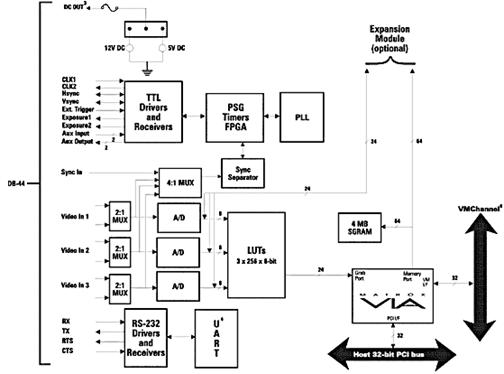
3.2 The frame grabber
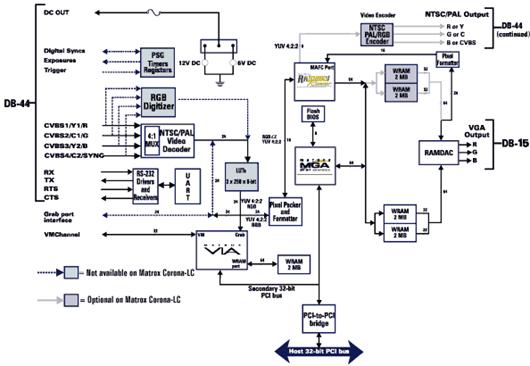
The figure below shows the schematics of a conventional framegrabber. The schematics farther down show a frame grabber integrated in a graphics card: the image from the frame grabber can be overlayed on the display image without losing processing power.